First steps and dashboard overview
Signing Into Your PrintReleaf Account:
Your Sales Rep will invite any initial users from your organization to access your PrintReleaf Dashboard. Once added, each new user will receive a welcome email with a prompt to create a login & password.
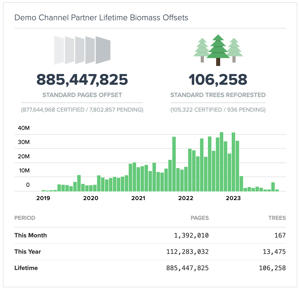
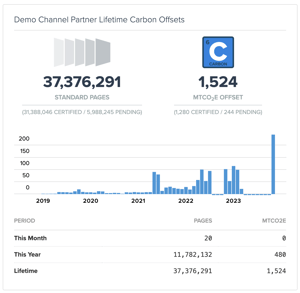
The PrintReleaf dashboard displays your environmental impact through intuitive graphics and real-time data.
Biomass Offsets and Carbon Offsets Graphs: These graphical representations show the total number of standard pages offset and the total standard trees reforested or carbon offset over time. This historical data, presented in bar graph format, allows you to track your sustainability efforts from 2019 to the present, offering insights into your progress and the impact of your choices.


Lifetime Metrics: Displayed prominently are the lifetime metrics, including the total number of pages offset and the trees reforested, as well as the carbon offset in metric tonnes. These figures provide a quick snapshot of your cumulative impact, emphasizing the long-term contributions to environmental sustainability.
Impact Statements Section
Here, you can access detailed reports of your environmental contribution:

Lifetime Impact Statement: Download a report representing your cumulative impact on PrintReleaf over the entire period of your participation.
Annual Impact Statement: Access a yearly report summarizing your environmental contributions for a specific year, such as 2022.
Partner Profile Area
Your PrintReleaf Partner Profile section is tailored to offer:

Profile Overview: Find your profile URL, company description, industry classification, and geographic location. This section helps in establishing your identity within the PrintReleaf network.
Profile Engagement: Track how many times your profile has been viewed, which can be indicative of the engagement level with your sustainability initiatives.
Management Options: Use the 'Edit Profile Settings' and 'View Your PrintReleaf Profile' to maintain the accuracy of your public-facing information and to ensure that it aligns with your current operations and marketing strategies.
'Integrations' (MPS Partners Only)
Designed for managing and monitoring the health of Print Monitoring Software.

Service Listings: Each integration, such as Printanista, 3manager, and Print Tracker, is listed with its corresponding URL, providing a clear reference point for the service's web location.
Health Status Indicators: Next to each service is a health indicator—either a green check for 'Healthy' or a red alert for 'Unhealthy'—providing immediate visual feedback on the service's current status.
Feeds Summary: A numerical summary offers a quick overview of the number of data feeds that are functioning properly ('Healthy') versus those experiencing issues ('Unhealthy').
View Server Button: This actionable element directs users to a more detailed analysis of each server's performance, allowing for deeper insight and troubleshooting capabilities.